Whether developing new products, enhancing operations, exploring new markets, or obtaining a larger market share, all organizational processes require innovation. In the organizational setting, solving problems is never a piecemeal task since they usually stem from numerous, related, and sometimes unrelated factors. Due to this, leaders and stakeholders should think innovatively to establish the underlying cause of the challenges before developing solutions. Alternatively, organizations should use creative thinking tools/techniques to view problems from different angles, and create, consolidate and transform ideas into the most suitable approaches (Langley et al., 2018). This paper discusses the role of mind mapping, process mapping, the fishbone cause and effects diagram, and the Six Hats Thinking technique in creative thinking.
Mind mapping
People often find it hard to fully understand and apply knowledge and concepts because of how they are presented. For instance, it is much easier for builders to construct a structure using a graphical representation rather than notes. As a creative tool, mind mapping works the same way. Mind mapping is a technique that employs images, diagrams, and lines to organize, analyze, link, and synthesize ideas. Historically, mind mapping had been in use even in the Renaissance. However, a psychologist named Tony Buzan is credited for popularizing its use (Crow & Sheppard, 2012).
Like other creative tools, mind mapping comprises different aspects that are equally crucial and interdependent. Firstly, mind mapping commences with determining the central concept or idea under scrutiny. For instance, in this paper’s context, the main idea is late delivery. After recognizing the main issue, the following process involves creating ideas/factors branching out of the prime concept informed by basic organizing ideas (Bois). Lastly, the principal and smaller ideas (branches) are named and numbered using simple terms.
Unlike traditional note-taking, mind mapping is a preferable creative tool because of its simplicity and artistic features. Mind mapping is a crucial technique preferred within and outside organizations. For instance, mind mapping helps students study and make notes from lectures and secondary sources. According to Edwards & Cooper (2010, p240), most learners find it easier to remember information presented in visual form than in text. In this sense, mind mapping promotes memorization and information retention. Besides, mind mapping is often used to link and integrate ideas from different team members through brainstorming. Using a mind map, an individual or a group can break down complex concepts, analyze them, and create approaches to dealing with them. Also, mind mapping facilitates the accumulation of information/ ideas, summarization, and presentation of such ideas clearly and concisely.
Process mapping
When implementing any idea, it is necessary to consider processes that determine the outcome of the envisioned. For instance, an organization aiming to maximize productivity must evaluate its performance and embark on training. Similarly, process mapping involves presenting a graphical description of the phases and procedures to attain a particular outcome (Marriot, 2018, p177). Like other creative thinking tools, process mapping comprises components like the input, processes, and outputs/ results. The input/s are the aspects that undergo the transformative process to materialize as output/s. Whether for individuals or organizations, process mapping is numerously beneficial to creative thinking. Firstly, it allows participants to scrutinize the process and make informed decisions. Secondly, process mapping enables participants to evaluate, identify, and address any weaknesses present in the process. Alternatively, it enables participants to discover and utilize emerging advantages. Thirdly, process mapping enhances responsibility and accountability between participants as each participant stays informed of their role in the process. Lastly, process mapping enhances efficacy by reducing defects and bottlenecks (Marriot, 2018, p181).
The Fishbone cause and effect diagram
When problems emerge in a process, it is imperative to establish the underlying cause instead of rushing to create solutions. In this sense, the Fishbone cause and effect diagram is an effective tool for breaking down a particular challenge to discover the primary factors contributing to the situation. Although the Fishbone technique was invented in the 1920s, it became more popular after Prof. Kaoru Ishikawa adopted it as a quality control mechanism at Kawasaki in Japan (Coccia, 2020, p225). The fishbone cause and effect model is like no other creative thinking tool. Typically, it resembles a fish skeleton placed facing to the right. As a creative thinking tool, the fish’s head represents the fundamental issue that extends to the left, creating a base where all other issues emanate (Coccia, 2020). Practically, the fishbone diagram can have as many levels as possible as long as they represent the possible causes of the problem.
The fishbone cause and effect diagram is numerously beneficial to creative thinking. Apart from identifying the root causes of the problem, it establishes the link between different aspects that ordinarily seem unrelated 9Coccia, 2020, p228). Besides, the fishbone tool facilitates brainstorming and knowledge development, essential to creative thinking. Furthermore, the diagram provides a solid framework and direction to narrow many issues to a common cause. In this case, it keeps participants from associating irrelevant issues with the one under investigation. Moreover, the fishbone model promotes creative thinking by breaking down complex concepts, allowing each aspect to be examined individually. Lastly, the diagram promotes profound thinking and prioritizes solving the underlying issue. It is suitable for creating properly informed and long-lasting solutions (Coccia, 2020, p228).
The Six Hat Thinking model
It is sometimes difficult to solve a problem because those we consult have a similar perspective. We can depend on people with different views and outlooks in this state of affairs. As a thinking and problem-solving technique, The Six Hats model was presented in 1986 by Edward de Bono as a creative tool that uses different types of thinking to solve problems, create ideas, and discover solutions that may not be available to people who think similarly (Smith, 2020, p55).
The Six Hats model builds on the notion that people think according to their personalities and create different ideas. In this model, each hat represents a unique thinking ability crucial for brainstorming, decision-making, and problem-solving processes. According to Smith (2020, p56), the white hat represents objective and analytical thinking devoid of emotions. The red hat denotes subjective and emotional thinking, often shrouded with feelings and opinions. The black hat represents pessimistic and skeptical thinking preoccupied with identifying problems and risks (Smith, 2020, p56). The yellow hat symbolizes optimistic thinking, focusing on any situation’s best outcome. The blue hat characterizes profound and visionary thinking. Lastly, the green hat signifies innovative and boundaryless thinking.
The Six Hats Thinking model has countless advantages as a creative thinking tool. Firstly, it enables participants to become aware that there are diverse perspectives concerning the issue at hand. Such awareness enables individuals to approach issues from different and the most suitable angles. For instance, before launching a new project, the manager can engage particular “Black Hat” employees to evaluate the risks and negative aspects of the potential endeavor. Typically, their views would differ from those of the optimistic Yellow Hats. Besides, the model provides an opportunity for profound thinking, communication, and learning, which are vital when making decisions and addressing problems.
Mind mapping illustration on the factors contributing to late deliveries
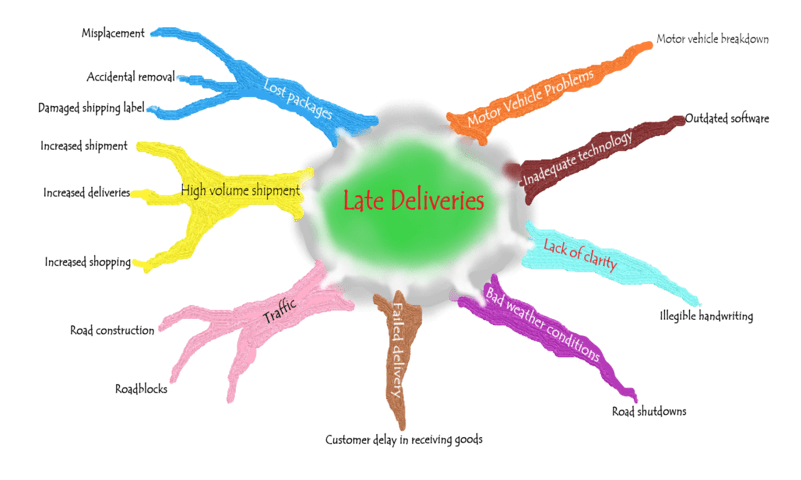
Figure 1. A mind-mapping illustration of the causes of late deliveries
Fishbone cause and effect diagram on the causes of late deliveries
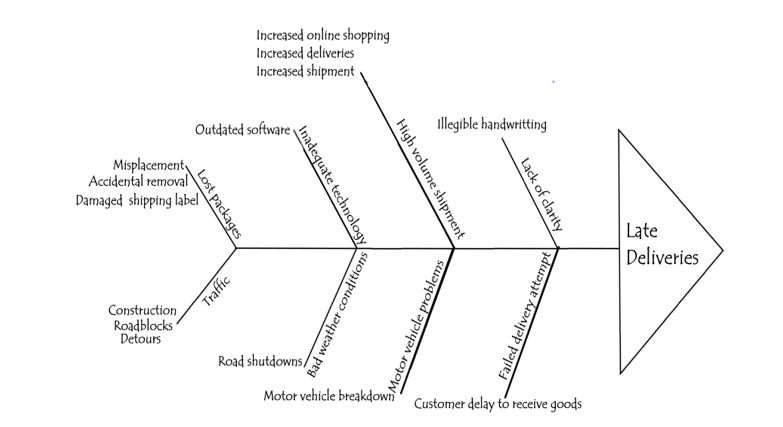
Figure 2. The fishbone cause and effect diagram on late deliveries
Application of the Six Hats thinking to the problem
Typically, there is no standard sequence or approach to applying the Six Hats Thinking tool since situations vary considerably. The following steps will be followed to apply the model.
- Blue Hat
This hat will facilitate deep reflection, overview, and understanding of the situation.
- Step 1: White hat
This will promote neutrality, calm, and suitable circumstances for stakeholder dialogue and communication.
- Red hat
This hat will encourage stakeholders to express their feelings and emotions concerning our organization’s challenges.
- Yellow hat
This hat will provide motivation, optimism, and hope to work ourselves out of our current situation and regain our client’s confidence and trust.
- Green Hat
This hat will encourage members to brainstorm, create ideas, and explore options beyond the obvious.
- Black Hat
This will be logically examined, and any faults, errors, and risks in our ideas and potential solutions will be identified.
Conclusion
This paper discusses the role of mind mapping, process mapping, the fishbone cause-and-effects diagram, and the Six Hats Thinking technique in creative thinking. Notably, each creative thinking tool plays a unique role in problem-solving. Mind mapping is the most straightforward technique linking various causal factors to the main issue. On the other hand, the process mapping technique is the most suitable approach to examining if and how errors occurring in the process affect the outcomes. The fishbone cause and effect technique is an appropriate framework for studying how various factors collectively relate to the main problem and vice versa. Lastly, the Six Hats Thinking model illustrates that problem-solving is multidimensional, so it is critical to employ different thinking perspectives as contexts dictate.
Reference
Coccia, M. (2020). Fishbone diagram for technological analysis and foresight. International Journal of Foresight and Innovation Policy, 14(2-4), 225-247.
Crowe, M., & Sheppard, L. (2012). Mind mapping research methods. Quality & Quantity, 46(5), 1493-1504.
Edwards, S., & Cooper, N. (2010). Mind mapping as a teaching resource. The clinical teacher, 7(4), 236-239.
Langley, J., Partridge, R., Wheeler, G., & Bec, R. (2018). Invited masterclass: Creative thinking and Problem solving.
Marriott, R. D. (2018). Process mapping–the Foundation for effective quality improvement. Current problems in pediatric and adolescent health care, 48(7), 177-181.
Smith, R. (2020). Which Hat Are You Wearing? Research-Technology Management, 63(2), 55-57.


